Figure 2.
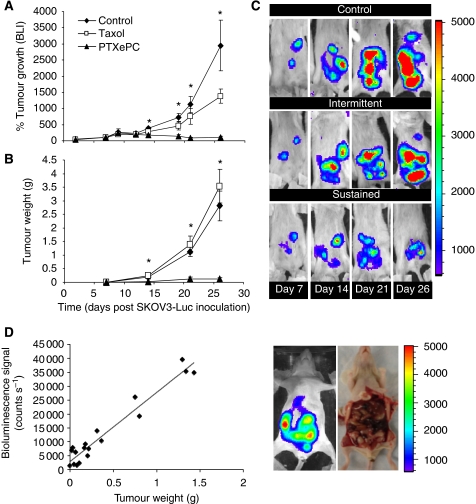
Tumour growth of SKOV3Luc xenografts in response to intraperitoneal chemotherapy. Paclitaxel therapy (60 mg kg−1 total over 3 weeks) was initiated 7 days post SKOV3Luc inoculation. Intermittent therapy consisted of 20 mg kg−1 on q7d × 3 schedule (days 7, 14, 21) and sustained therapy consisted of surgical implantation of PTXePC releasing 20 mg kg−1 per week (n=9 per group). Non-treated and drug-free ePC implant controls were combined (n=18). (A) Relative bioluminescence – bioluminescent signal (counts/s) was normalised to treatment initiation date for individual animals (day 7 post SKOV3Luc inoculation); the number of mice per group changed as the study proceeded, therefore the bioluminescent signal was obtained from n=39 on day 0 and 7; n=6–15 per group on day 14; n=3–8 per group on day 21 and n=4–5 per group on day 26; (B) Tumour growth curve; n=3–6 tumours per group at each time point (obtained from n=3–6 mice per group); (C) Representative examples of successive in vivo bioluminescent images of tumour growth in the same animal for each group. Each image was collected for 5 min. The colour scale bar indicates photon count per pixel. There was a significant difference in tumour growth between groups as measured by bioluminescence and tumour weight, P<0.05, ANOVA (*). (D) Regression analysis revealed significant correlation between bioluminescence and tumour weight (r=0.97, P<0.05). The anatomical location of tumours upon macroscopic examination reflected bioluminescence.

