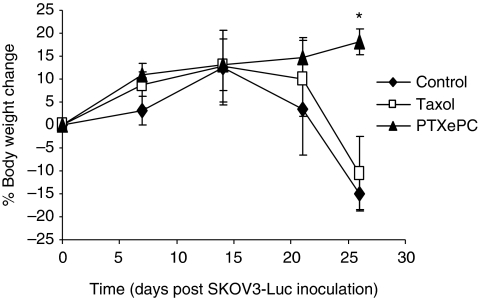
Figure 5.
Body weight changes in response to chemotherapy. Control- and Taxol-treated animals encountered significant weight loss by day 25, indicating disease progression. Furthermore, weights in the PTXePC treatment group significantly differed from control- and Taxol-treated animals, P<0.05, Student's t-test (*). The number of mice per group changed as the study proceeded, therefore body weights were obtained from n=39 on day 0 and 7; n=6–15 per group on day 14; n=3–8 per group on day 21 and n=4–5 per group on day 26. Data presented as mean±s.e.

