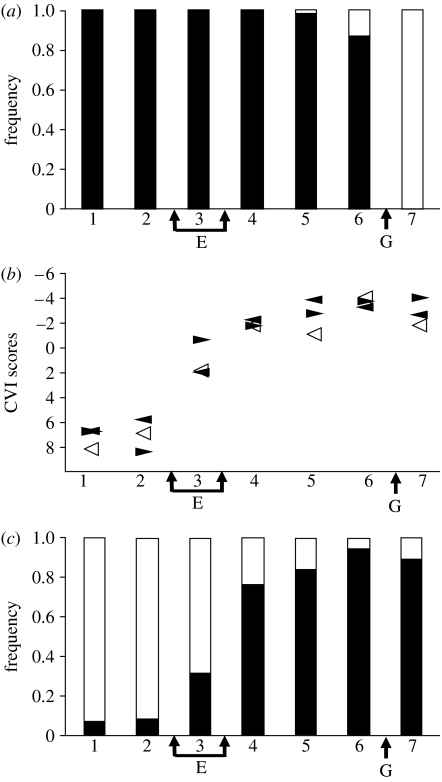
Figure 5.
Transects showing (a) lineages, (b) selection regimes and (c) genotype structure. The transect localities (mapped in figure 3) are arranged in geographical order on the horizontal axis, with E representing the position of the ecotone (the switch between xeric coastal woodland and montane rainforest) and G the position of secondary contact between the northwest (localities 1–6) and central (7) geological regions. (a) The frequency (48 individuals per locality) of the northwest (black) and central (white) mtDNA lineages. (b) Mean first canonical variate (CVI) scores for adult males based on their quantitative traits (right-pointing filled triangles) and dewlap hue (left-pointing filled triangles), and the first principal coordinate score of environmental variables (open triangles). The CV scores are in units of 2 within group standard deviations. (c) The frequency of individuals (48 individuals per locality) assigned to the two Bayesian clusters, ‘xeric’ (white) and ‘montane rainforest’ (black), based on variation in nine unlinked microsatellites.

