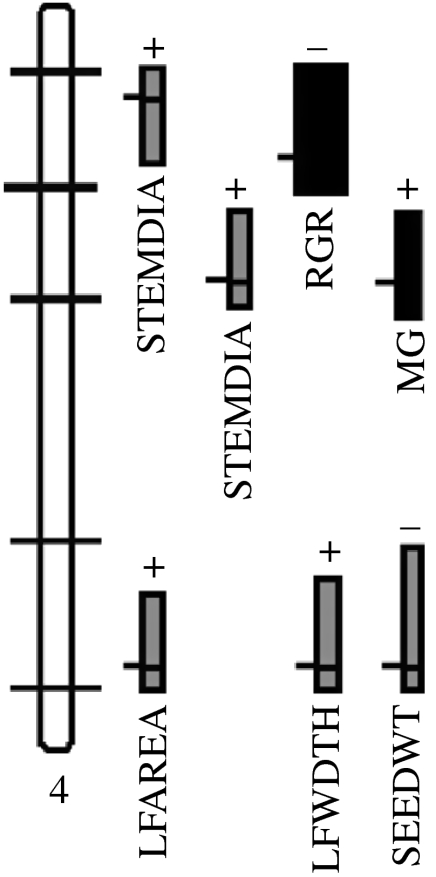
Figure 1.
QTL analysis in a complex interspecific pedigree facilitates the simultaneous mapping of inter- and intraspecific QTL potentially involved in ecological divergence in Helianthus. Linkage group 4 of Helianthus is shown as an example. Marker positions are indicated by horizontal bars along the linkage group. Shown as blocks to the right of the group are interspecific QTL positions and support limits with interspecific effect sizes indicated by the horizontal width of each block. All interspecific QTL positions were also tested for the presence of intraspecific QTL, and positions at which intraspecific QTL polymorphism was found are shown in black. The average effect size of intraspecific QTL (not shown) was less than one-third that of interspecific QTL. STEMDIA, stem diameter; RGR, relative growth rate; MG, magnesium uptake; LFAREA, leaf area; LFWDTH, leaf width; SEEDWT, seed weight. Modified from Lexer et al. (2005a).

