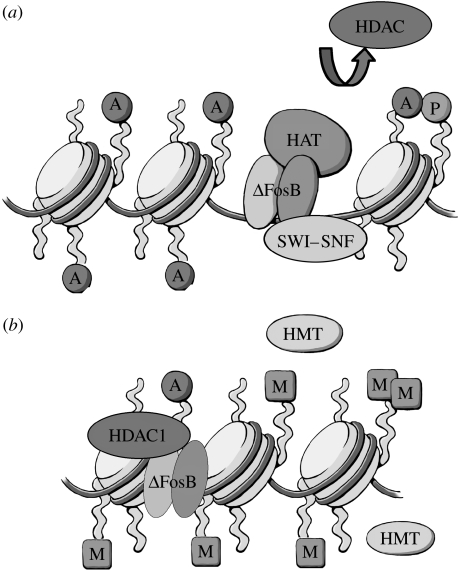
Figure 3.
Epigenetic mechanisms of ΔFosB action. The figure illustrates the very different consequences when ΔFosB binds to a gene that it activates (e.g. cdk5) versus represses (e.g. c-fos). (a) At the cdk5 promoter, ΔFosB recruits HAT and SWI–SNF factors, which promote gene activation. There is also evidence for exclusion of HDACs (see text). (b) By contrast, at the c-fos promoter, ΔFosB recruits HDAC1 as well as perhaps HMTs which repress gene expression. A, P and M depict histone acetylation, phosphorylation and methylation, respectively.

