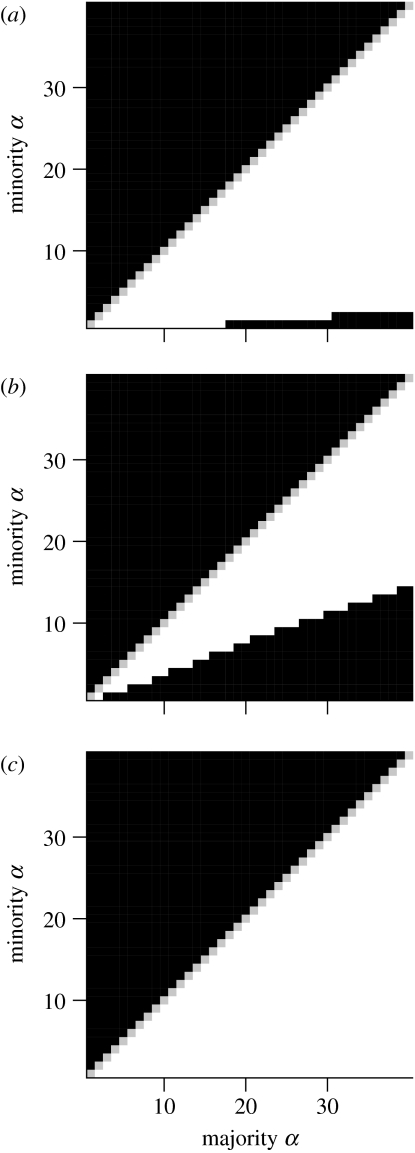
Figure 2.
(a,b) Relative communicative accuracy of various combinations of strengths of prior in sampling populations ((a) b=3; (b) b=9). Black cells indicate the minority α-value will be selected against (rca<1), white cells indicate the minority α-value will be selected for (rca>1) and grey cells (seen on the diagonal) indicate selective neutrality (rca=1). (c) An example result given the global evaluation of communicative accuracy (b=9); see text for details.

