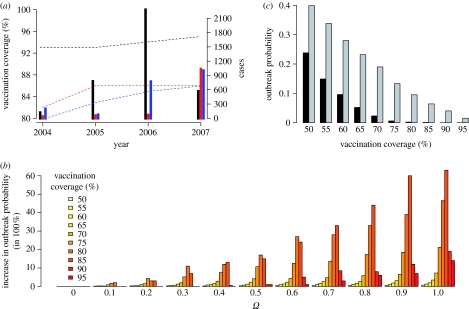
Figure 1.
(a) Vaccination coverage and measles prevalence. Data are from Switzerland (red), Germany (black) the UK (blue). The dashed lines show the vaccination coverage and the bars show the number of reported cases in each year. (b) Increase in outbreak probability. Each bar of a given colour (i.e. vaccination coverage) represents the increase in outbreak probability relative to the lowest non-zero outbreak probability at this vaccination coverage. The parameter Ω measures the strength of opinion formation: the probability that an individual swaps opinion is given by the frequency of neighbouring individuals who hold the opposite opinion, weighted by Ω, i.e. Ω=0 indicates that no opinion formation occurs. The data given are based on 220 000 simulations of networks of 2000 nodes, and an outbreak was registered when the initial infection led to at least 10 follow-up infections (for a detailed description of the model see §2.2). For each value of Ω, we tested 11 different levels of vaccination coverage from 0.5 to 0.95. (c) Effect of opinion formation on herd immunity. Outbreak probabilities without opinion formation (black bars, Ω=0) and with opinion formation (grey bars, Ω=1).

