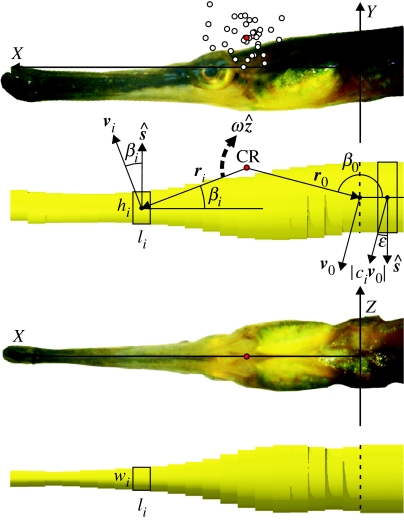
Figure 3.
Geometry and symbols of the model used for calculating power requirement during prey capture in pipefish. Open circles on the top picture are the centres of rotation for each of the analysed feeding sequences. The average of these points will be referred to as the CR (centre of rotation, red circle). The following reference frame was used: the line through the middle between the right and left posteriormost points on the opercula was defined as the Z-axis. The origin (0,0,0) is the middle between these two points. The X-axis runs to the dorsal tip of the snout (i.e. the base of the maxilla), while the Y-axis is perpendicular to the XZ-plane and points dorsally. Indicated on the model drawings beneath the lateral and ventral pictures are: width (wi), height (hi) and length (li) of the elliptical cylinders that constitute the pipefish's head and body, vectors ri between CR and the centres of mass of each subdivision, angle βi between the anterior–posterior axis of the head and ri. The direction of positive angular velocity ω (vector notation ) is indicated by the dashed arrow. The dashed line separates head and body in the model. More information is given in the text and appendix A.

