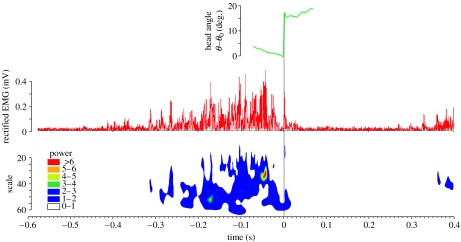
Figure 6.
Representative example of an EMG of the epaxial muscle during prey capture in S. leptorhynchus. The graphs show head rotation kinematics (green), rectified EMG signal (red) and a contour plot resulting from the Morlet wavelet analysis. The phase of fast dorsal rotation of the head is indicated by the grey bar (time 0 until 0.0055 s). Note that the scale axis of the wavelet graph is inversely related to frequency so that regions on the graph further away from the time axis represent higher EMG frequency. Colour codes indicate EMG power.

