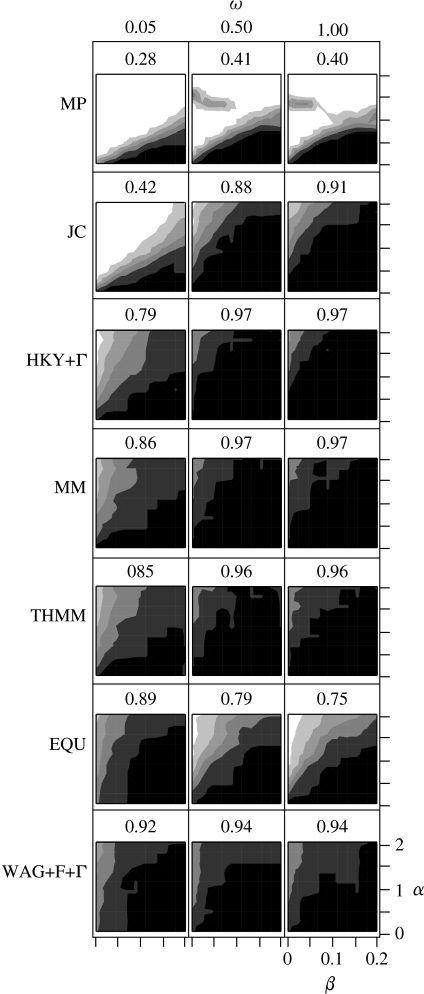
Figure 3.
Performance of phylogenetic tree estimation by a range of methods under different simulation conditions. The numbers above each plot describe the average probability of a method recovering the tree used to simulate the data. The square plots show the distribution of this probability (see text for more details), with probabilities covered by the following ranges:  , 1.0;
  , 0.8–0.99;
  , 0.6–0.79;
  , 0.4–0.59;
  , 0.2–0.39;
  , 0–0.19.

