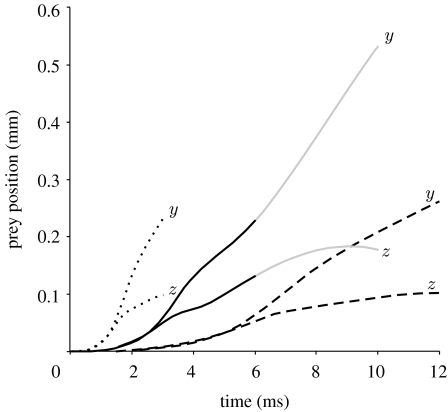
Figure 6.
Plots of prey displacement along the z-axis (ventral to dorsal) and y-axis (posterior to anterior) due to the pipefish head model (figure 2) rotating at three different speeds (solid black line, cranial rotation S. leptorhynchus; solid grey line, cranial rotation S. leptorhynchus after end of rotation; dotted line, velocity×2, acceleration×4; dashed line, velocity/2, acceleration/4). The ends of the black curves indicate prey position at the time the head has completed the rotation of 21.15°. The grey curve shows prey displacement after the head has stopped rotating (cf. figure 5).

