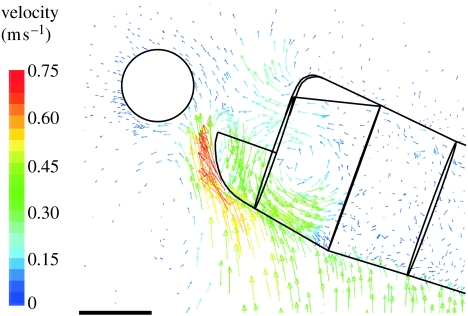
Figure 7.
Velocity vector plot (midsagittal plane) focusing on the mouth near the instant when the prey is sucked through the mouth aperture (5.517 ms after the onset of cranial rotation). Note the upward-directed high-velocity flows just passing the lower jaw region. On the other hand, low flow velocities (less than 0.2 m s−1) characterize the prey's surface region (see also figure 5). The velocity colour scale is indicated on the left. Scale bar, 1 mm.

