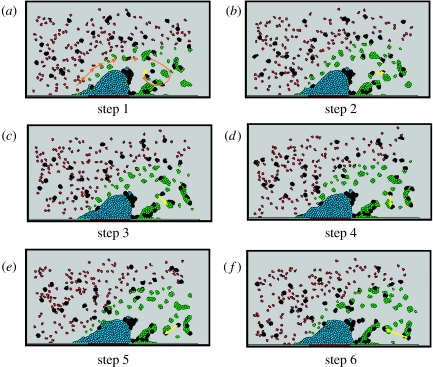
Figure 10.
Vorticity in thrombus formation process. (a–f) Six snapshots from time 23.1 to 24.3 s, with time step 0.24 s. The figure demonstrates the moving direction of platelets and blood cells under vortical flow. Orange arrow, flow direction; yellow arrow, marker for showing two blood cells' moving tracks.

