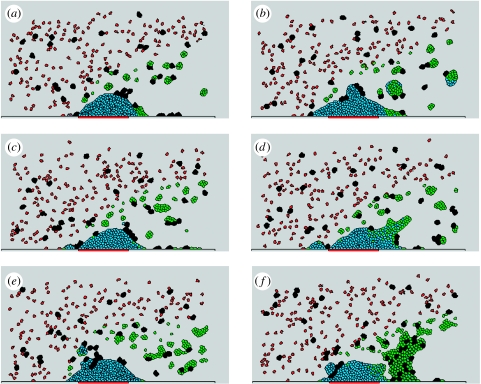
Figure 6.
Simulation results with different adhesion energy constant values after 24 s. J1 is an adhesion energy constant of activated platelet–activated platelet interaction and J2 is the adhesion energy constant of activated platelet with higher fibrin–activated platelet with high fibrin. (a) J1=J2=4, (b) J1=J2=6, (c) J1=J2=8, (d) J1=12, J2=8, (e) J1=26, J2=4, (f) J1=2, J2=8. Other parameters are listed in table 2.

