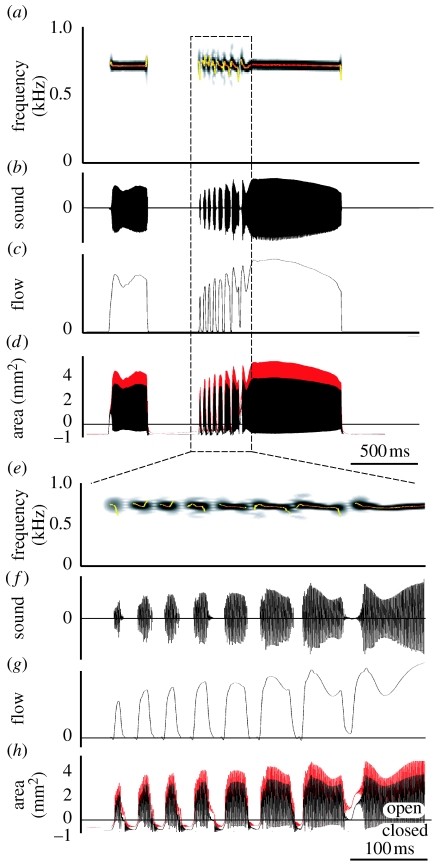
Figure 5.
Simulation of the ring dove coo. (a) Sound spectrogram, (b) sound oscillogram, (c) flow in the trachea, (d) area of syringeal aperture for mass 1 (black trace) and mass 2 (red trace). (e–h) Same signals zoomed in on the trill. Superimposed on the spectrograms is a fundamental frequency analysis (colour represents sound amplitude). Negative areas in (d,h) indicate that the syrinx is closed in between sound elements.

