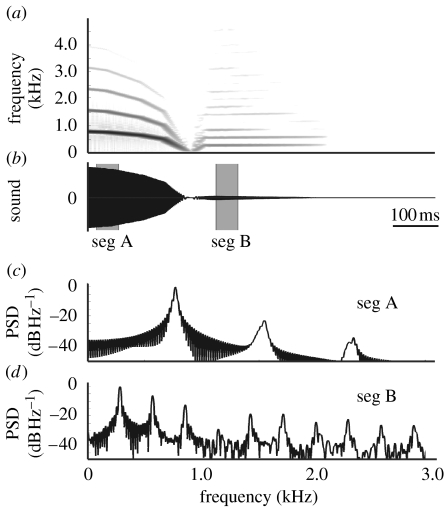
Figure 7.
Simulation of the asymmetry expiration/inspiration. (a) Spectrogram and (b) oscillogram of expiratory and inspiratory note simulation. (c) Power spectral density (PSD) estimations of segment A (seg A) during expiration and (d) segment B (seg B) during inspiration. Segments are taken from (b) as indicated.

