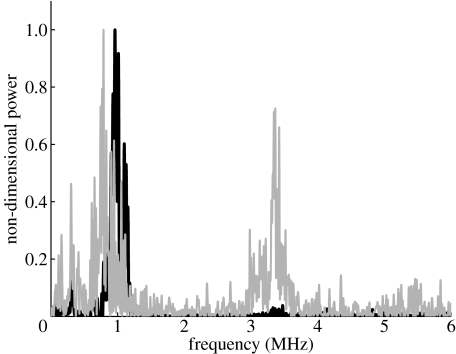
Figure 4.
Experimental measurements of backscattered ultrasound power showing the amplification of nonlinear behaviour. The black curve shows the frequency spectrum for the backscattered power from a suspension of surfactant (PEG40S)-coated bubbles. The grey curve shows the frequency spectrum for a similar suspension containing bubbles of equal size and concentration, but coated with both PEG40S and gold nanoparticles (cf. figure 3). The sound field parameters are as specified for figure 1.

