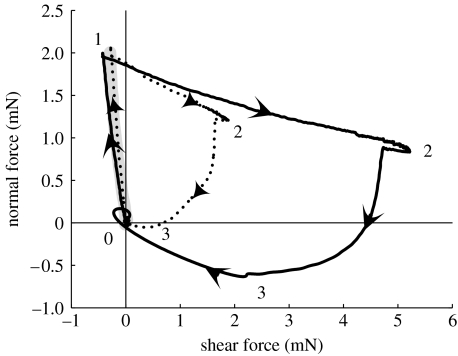
Figure 8.
Normal versus shear force shows increasing frictional adhesion after 146 LDP trials in the same spot. Also shown is a load/pull experiment performed prior to LDP experiments. Numbers along curves correspond to the loading stages shown in figure 3b. Grey line, load/pull; dotted line, first shear test; black line, 146th shear test.

