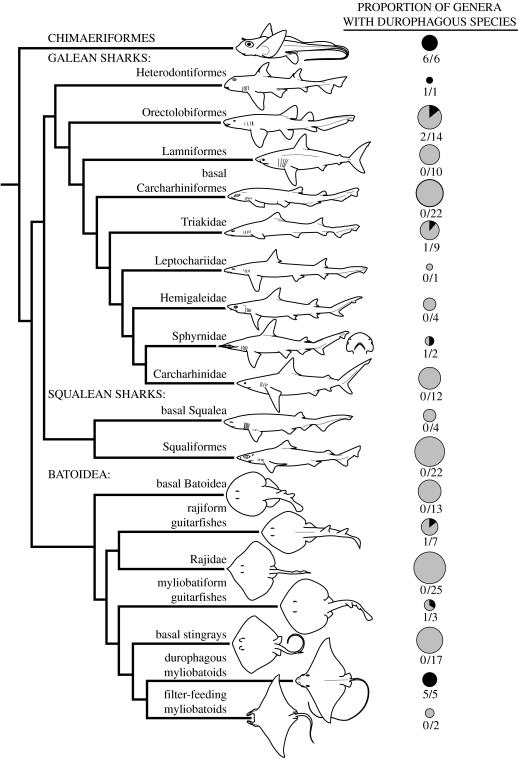
Figure 1.
Cladogram of the cartilaginous fishes indicating the occurrence of hard prey consumption (durophagy). Circles to the right indicate the proportion of genera within a given taxonomic grouping which have durophagous species (black shade, durophagous; grey shade, non-durophagous; Compagno 2005; Dean et al. 2007b). Circle size is scaled to the total number of genera in a given taxonomic grouping. The topology of the cladogram is based on Compagno (2005), with some clades collapsed for simplicity.

