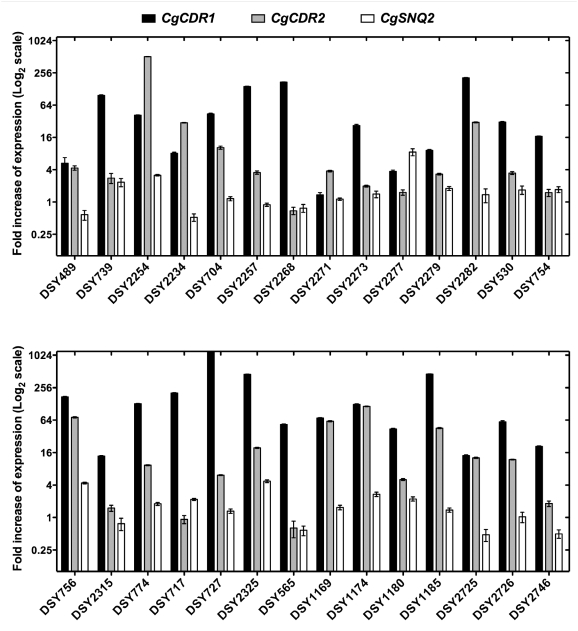
Figure 1. Expression of CgCDR1, CgCDR2, and CgSNQ2 in C. glabrata azole-resistant isolates from groups of sequential clinical isolates.
Quantification was performed by real-time RT-PCR. The values, which are averages of four separated experiments, represent the increase in gene expression relative to the azole-susceptible parental strains (set at 1.00). Error bars show standard deviations.

