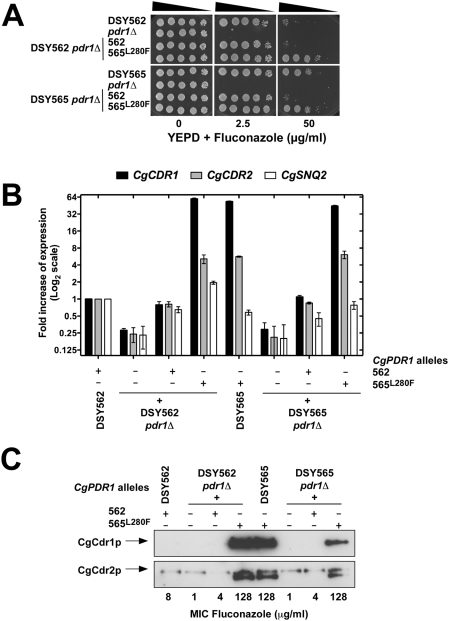
Figure 5. Quantitative analysis of azole resistance in selected C. glabrata isolates.
(A) Fluconazole susceptibility testing of C. glabrata clinical isolates DSY562 and DSY565 and their derivative mutants. Isolates were grown on YPD medium containing the drug at the indicated concentration at 30°C for two days. The indicated genotypes correspond to the following strains: DSY562 pdr1Δ: SFY92; DSY565 pdr1Δ: SFY94; DSY562 pdr1Δ+562 (standing for re-introduction of CgPDR1 from DSY562): SFY114; DSY562 pdr1Δ+565L280F (standing for re-introduction of CgPDR1 from DSY565 with L280F substitution): SFY115; DSY565pdr1Δ+562: SFY118; DSY565 pdr1Δ+565L280F: SFY119. (B) Expression of CgCDR1, CgCDR2, and CgSNQ2 in C. glabrata clinical isolates DSY562 and DSY565 and their derivative mutants. Quantification was performed by real-time RT-PCR. The values, which are averages of four separated experiments, represent the increase in gene expression relative to DSY562 (set at 1.00). Error bars show standard deviations. (C) Immunodetection of CgCdr1p and CgCdr2p in C. glabrata clinical isolates DSY562 and DSY565 and their derivative mutants. Proteins extract were separated by SDS-10% PAGE and immunoblotted with rabbit polyclonal anti-CgCdr1p and anti-CgCdr2p antibodies as described previously [9]. MICs to fluconazole were determined by broth microdilution method in accordance with the CLSI M27-A2 document.

