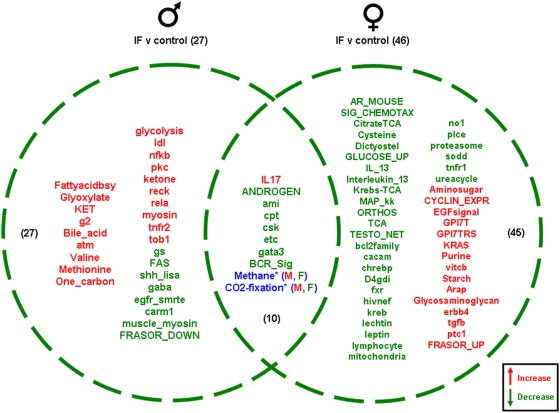
Figure 11. Pathway changes in the gonads of male and female rats maintained on the IF diet compared to the gonads of male and female rats maintained on the control (ad libitum) diet.
Significantly regulated, functional pathway clusters were generated from the respective male or female gene sets using PAGE gene set analysis. Pathways that were significantly up-regulated (red) or down-regulated (green) were clustered into a Venn diagram. Pathways in blue were common to both males (M) and females (F) but were differentially regulated. Names of the significantly altered pathways can be found in Table S2.

