
Figure 1.
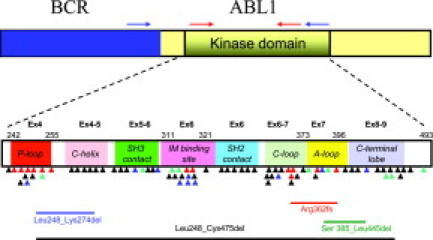
Schematic of the BCR-ABL fusion transcript and the location of reported KD mutations and alternate transcripts. Common areas for location of BCR (blue box) and ABL1 (yellow box including KD) primers for nested PCR (blue arrows) and BCR-ABL KD PCR (red arrows) used for direct sequencing assays are indicated. Colored triangles indicate the location of KD mutations reported in TKI-resistant samples (black for imatinib, green for nilotinib/imatinib, blue for dasatinib/imatinib, and red for all three TKIs). The KD subdomains, exons, and amino acid numbers are shown. P-loop: phosphate binding loop; IM binding site: imatinib binding region; C-loop: kinase catalytic domain; and A-loop: activation loop. The locations of four deletions in the BCR-ABL transcript that were most commonly reported in our laboratory survey are included in the lower part of the figure.