
Figure 4.
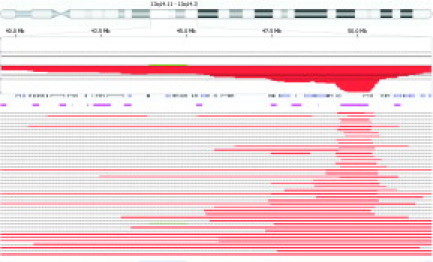
Mapping of the extent of deletions at chr 13q14 in CLL. Penetrance plot of the 41 cases in both the pilot and validation studies that had detectable deletions spanning the D13S319 locus at chr 13q14.3. Using Nexus software settings detailed in the Materials and Methods, variable sized deletions are observed. The area of analysis spans chromosome 13 from 13q14.11 to 13q14.3. The percentage penetrance for all cases within the area of analysis is illustrated by the solid red area. The open boxes and solid bars below the percentage penetrance represent genes within the area of analysis. The horizontal pink lines represent copy number variants within the area of analysis. The horizontal red lines at the bottom of the figure represent the extent of deletion within the area of analysis for each individual case. Please refer to Table 5 for the genomic coordinates and deletion size for each individual case.