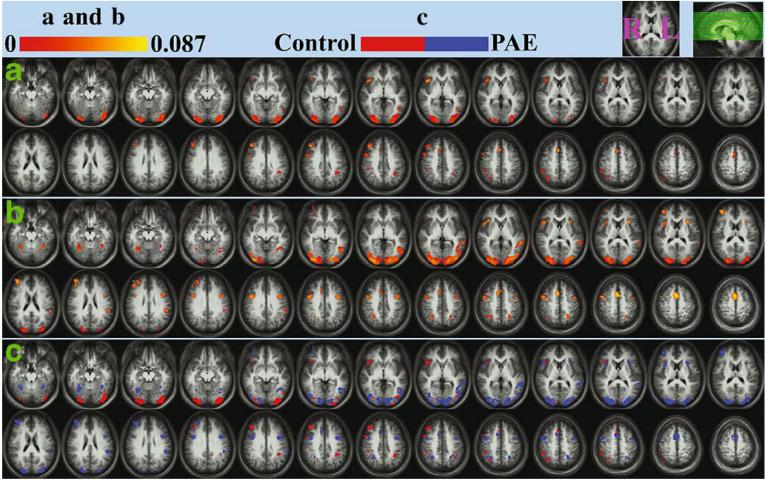
Fig. 2.
The “sustained attention” brain activation of the normal controls (a), PAE subjects (b) and the activation contrast between these two groups (c). The activation maps (a and b) were generated by averaging the individual data within group and applying a voxel-wise plus cluster threshold (z-score threshold p<0.01/voxel plus cluster threshold 665 mm3: p<0.01/overall). The color coding (in a and b) represents the magnitude of the regression coefficient. The contrast map (c) was generated by subtracting activated voxels of the PAE subjects from those of the controls (blue area, only activated in PAE subjects; red area, only activated in controls). The left/right (L/R) hemisphere and the slice locations are shown at the upper right corner of the graph. The anatomical underlays here are the averaged images of all the 14 participants

