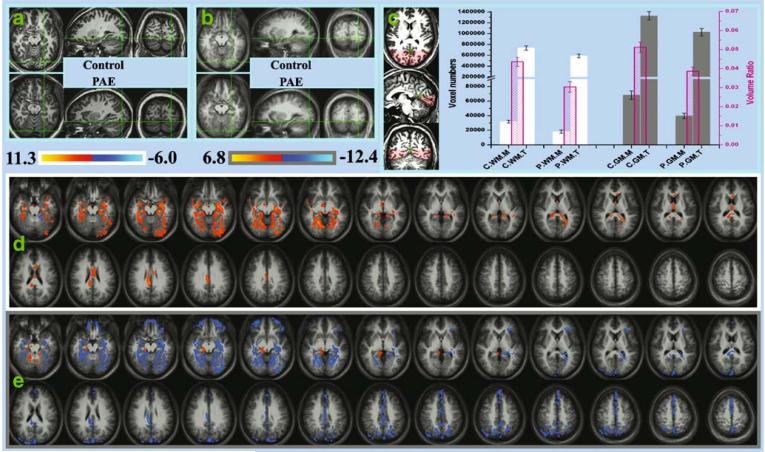
Fig. 3.
a The anatomical comparison between one control (upper row) and one PAE subject (lower row). The green cursor marked the same Talairach position in the two subjects. While the occipital-temporal cerebral structure can still clearly be seen with Z=-10 mm in the control, the PAE subject almost only show cerebellum in the same area. b The same comparison as in (a), but the images are substituted by group means. More (less) white (gray) matter at the cursor position can be seen in the controls. c The comparison of white and gray matter volume between the control and exposed group. The green cross in the anatomical images marked the intersection point of the parietal-occipital sulcus and the calcarine sulcus. The individual occipital-temporal ROI mask covers the cerebral structure lower than and posterior to this point (the shaded area). The white and gray bars represent the volumes of the white and gray matter, respectively, in units of voxel number (left axis). The pink bars (scaled by the right pink axis) represent the ROI-mask/whole-brain volume ratio (i.e., the height ratio of the two bars standing behind). The error bars represent the standard error. C: control, P: PAE, WM: white matter, GM: gray matter, M: mask ROI volume, T: total brain volume. d/e The VBM result of the white/gray matter density (denoted by a white/gray frame, respectively). The slice locations here are exactly the same as those shown in Fig. 1. The color coding represents the t value from the control-PAE group t-test. Areas with a higher density in controls/PAEs are thus marked by red-yellow/blue-cyan. The maps have a threshold of p<0.05/voxel plus 3,511 mm3 cluster (p<0.01/overall)

