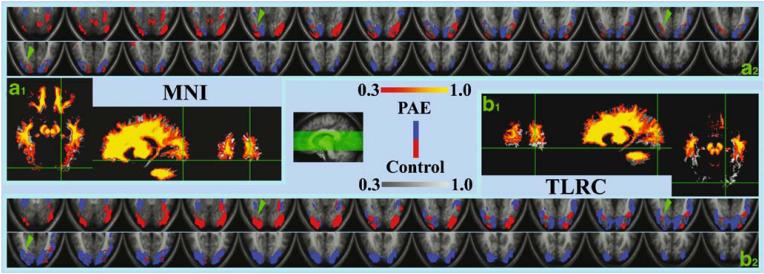
Fig. 4.
The control vs. PAE anatomy and activation difference based respectively on the MNI (a) and TLRC (b) normalization. The a1 and b1 are the white matter segments of the brain. By overlay the PAE images (red and yellow) on the controls (gray scale), it can be seen that the temporal-occipital displacement shown in the TLRC space (b1) is corrected/compensated by the MNI transformation (a1). The a2 and b2 are the functional activity subtraction maps as shown in Fig. 2c but the display here just focuses on the ventral part of the temporal-occipital area. For convenient comparison purpose, the original TLRC subtraction result was transformed into the MNI space and re-sliced so that the slice location in the a2 and b2 are exactly the same. Although more mutual cancellations were shown in the MNI based subtraction (e.g., compare the locations marked by the green arrows in the a2 and b2), the group functional activation differences could not completely be removed. The activations of the PAE group still appear higher then those of the controls even after the MNI correction. The slice locations in the a2 and b2 are shown at the center of the figure. In the white matter comparison (a1 and b1), the color coding (0.3-1.0; red and yellow for the PAE subjects; gray scale for the controls) represents the probability a voxel can be identified as the white matter. In the subtraction maps (a2 and b2), red/blue spots represent activations only in the control/PAE group

