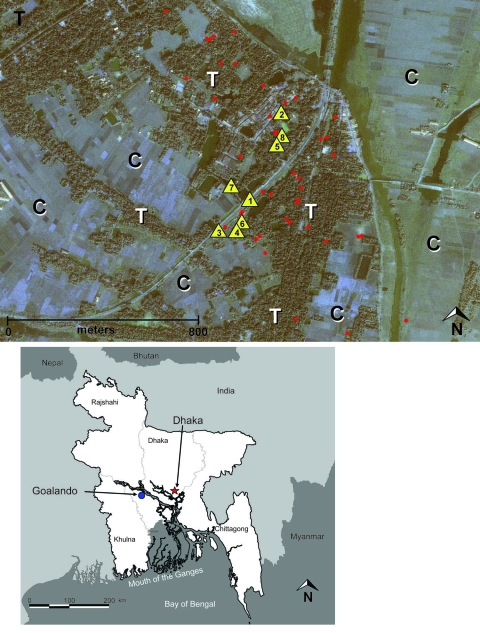
Figure 1.
Top: Distribution of Nipah virus case (n = 12) and control (n = 36) households within the outbreak/study site of Goalando township, Bangladesh, January 2004. Number in the yellow triangle corresponds to household no. in Figure 2. Map also shows extreme habitat disturbance; areas under cultivation (for rice, sugar cane) are highlighted with “C,” and remaining trees (fruit trees and bamboo stands) with “T.” Bottom: Location of outbreak village.

