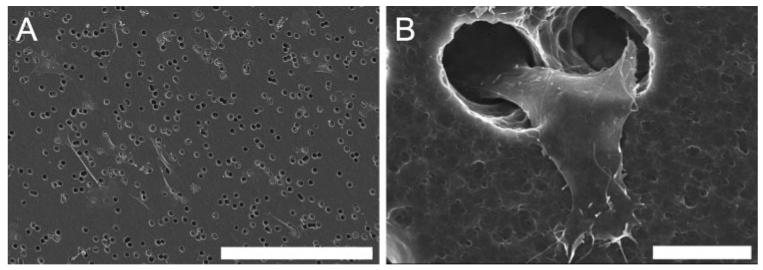
Figure 3.
SEM images of ECs which have migrated to the bottom surface of an 8-μm diameter pore polycarbonate membrane. (A) An example image of Rf/6a chorioretinal ECs used for quantitative analysis. (B) Cells were counted only if a portion of the cell had begun to emerge from the pore, as shown in detail in this micrograph of a human choroidal EC. Scale bar: (A) 300 μm; (B) 10 μm.

