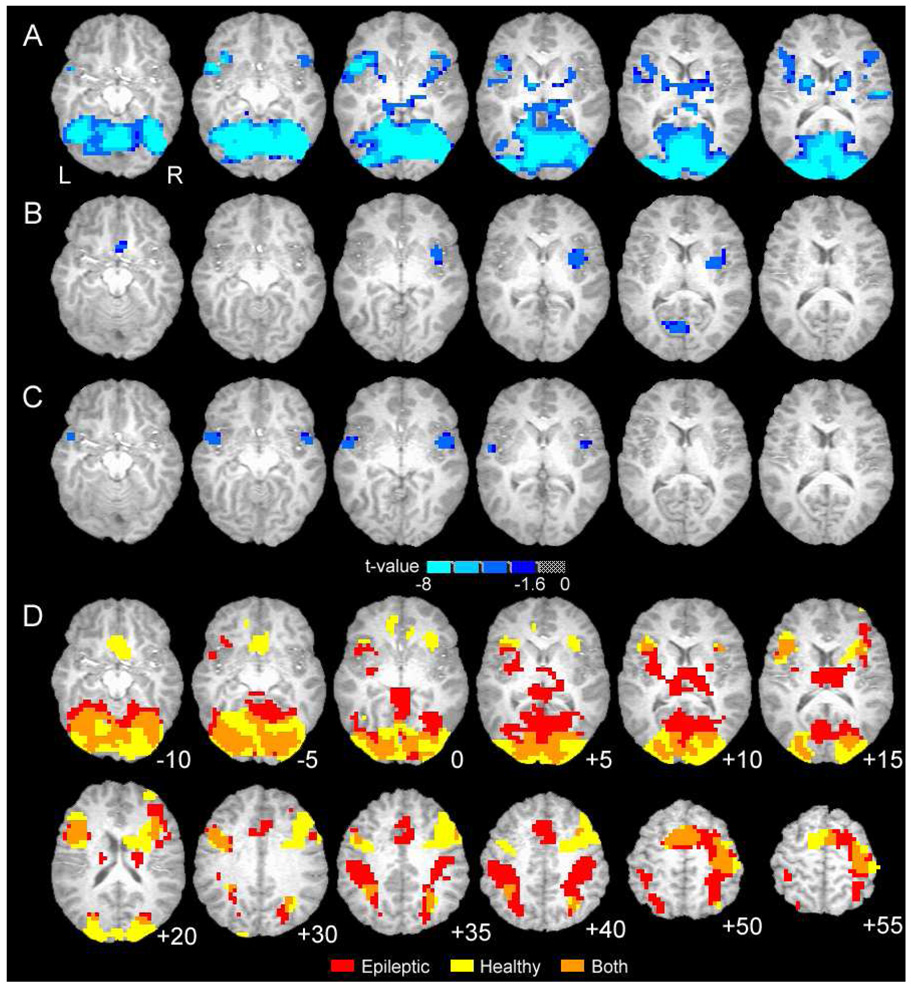
Figure 1.
Group brain activation maps showing statistical results (A–C) and word recognition activation similarity (D). A. Contrast between healthy and epileptic subjects for word recognition task, includes target and foil words (main effect of Group from regression). B. Difference in brain activation between healthy and epileptic subjects for target-foil word difference (Group [healthy/epileptic] by Condition [target/foil] interaction from regression). C. Difference in brain activation between healthy and epileptic subjects for target words (two-way t-test comparing patterns in D). For A–C blue-cyan indicates negative t-value and greater activation for epileptic subjects. D. Overlap of activation patterns for healthy and epileptic subjects during recognition of memorized (target) words only (overlap of each group’s one-way t-test). Additional superior brain regions are shown. For D, red is epilepsy patients only, yellow is healthy subjects only, orange is overlap of both groups.

