Figure 3.

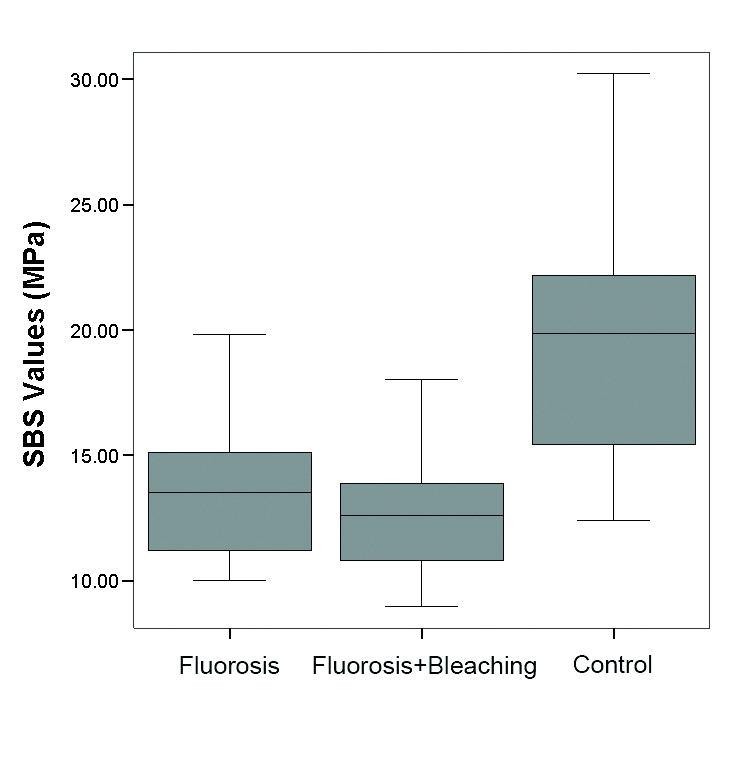
Shear bond strengths (MPa) of the groups. Results presented as boxplots. Horizontal line in middle of each boxplot shows median value; horizontal lines in box indicate 25% and 75% quartiles; lines outside box indicate 5% and 95% quartiles.

Shear bond strengths (MPa) of the groups. Results presented as boxplots. Horizontal line in middle of each boxplot shows median value; horizontal lines in box indicate 25% and 75% quartiles; lines outside box indicate 5% and 95% quartiles.