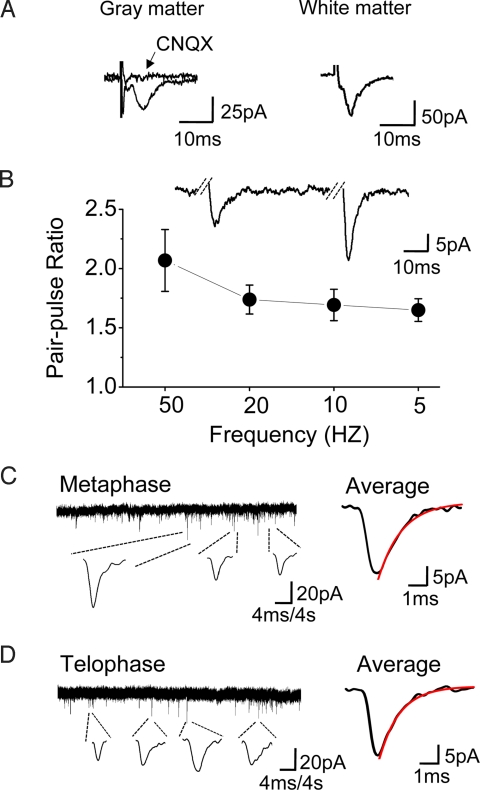
Fig. 4.
Dividing NG2 cells with functional synapses. (A) Evoked synaptic currents recorded from the dividing cells in gray matter (Left) and white matter (Right). (Left) The synaptic response was blocked by AMPAR antagonist CNQX (10 μM). (B) PPF in dividing NG2 cells at various frequency (n = 3–5 cells for each condition). (Inset) An example trace of pair-pulse at 20 Hz. (C and D) Spontaneous postsynaptic currents recorded in two dividing cells (low Cl−, 15 mM). Continuous traces represent the current recorded from the cells in metaphase (C) and telophase (D), respectively. Traces below show example responses in higher magnification. The average of individual responses in Left is shown in Right (C, n = 18; D, n = 13). The red line is a single exponential fit to the decay. C, rise time (10–90%), 0.80 ms; τ decay (90–37%), 1.50 ms; D, rise time, 0.70 ms; τ decay, 1.30 ms. All of the recordings were from a holding potential of −60 mV.

