
Figure 1.
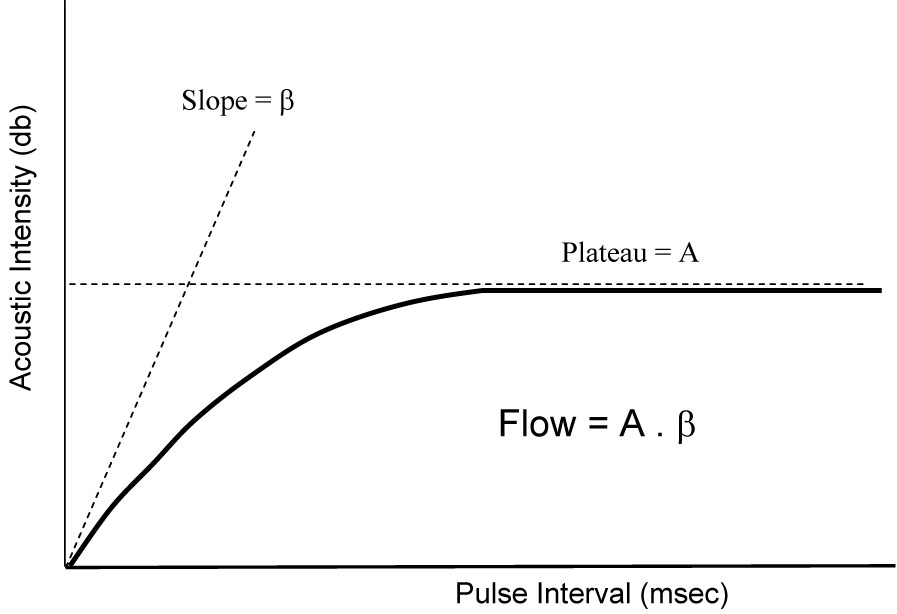
Changes in acoustic intensity versus pulse interval after destruction of microbubbles with high energy ultrasound in the tissue. β or slope of the curve representsthe velocity of blood in the tissue and A or plateau of the curve is tissue blood volume. The product of the two (A*β) represents tissue blood flow.