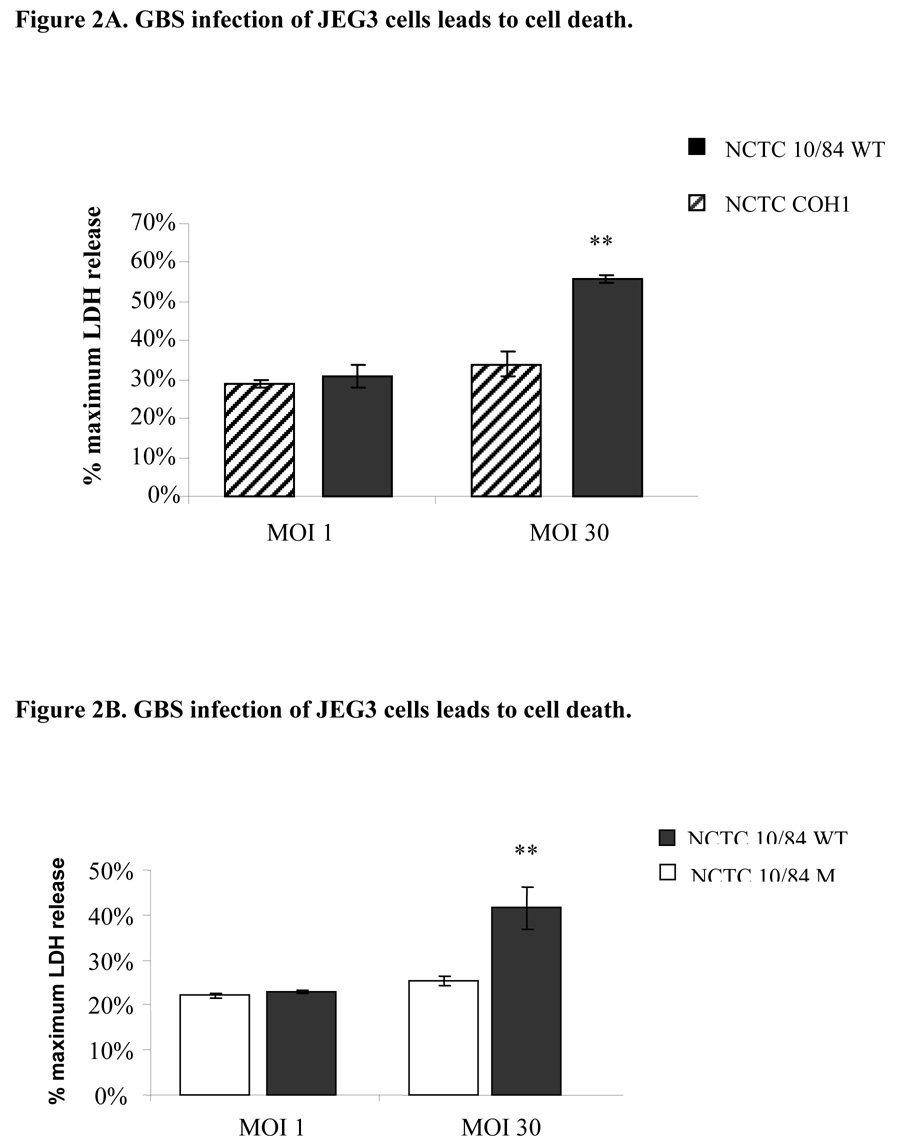
Figure 2.
Trophoblast monolayers (50,000 cells/well) were infected with highly hemolytic (NCTC10/84), low hemolytic GBS (COH1; Figure 2A) or non-hemolytic mutant NCTC10/84M strains (Figure 2B), and cell death was assessed after 1 hour by measuring the supernatant LDH release. Multiplicity of infection of 1 (5×10⁴ cfu) and 30 (1.5×10⁶ cfu) were used. The data shown is the representative of three separate experiments. Error bars represent the +/−95% confidence intervals of the mean of eight wells. ** P < 0.001 compared with low hemolytic GBS (COH1; Figure 2A) and ** P < 0.001 compared with mutant GBS (NCTC10/84M; Figure 2B).

