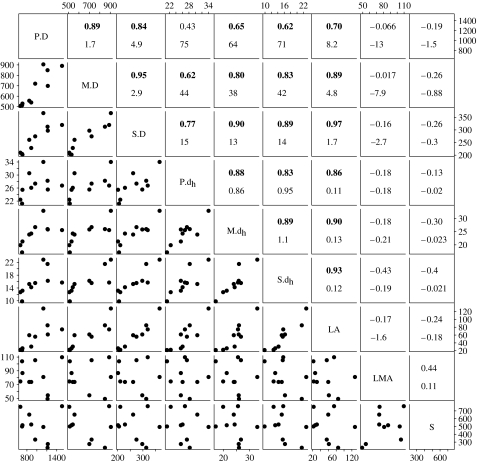
Figure 2.
Correlations among foliar traits measured for 10 species of oak. The upper right panels contain Pearson correlation coefficients (upper number, all values in bold are greater than 0.60 and significant at p<0.05) and SMA slopes (lower number); none of the variables were transformed. The lower left panels show the data points. The traits are abbreviated along the diagonal as follows: P.D, petiole vein diameter; M.D, midrib vein diameter; S.D, secondary vein diameter; P.dh, petiole vessel mean hydraulically weighted diameter; M.dh, midrib vessel mean hydraulically weighted diameter; S.dh, secondary mean hydraulically weighted vessel diameter; LA, leaf area; LMA, leaf mass per unit area; S, stomatal density.

