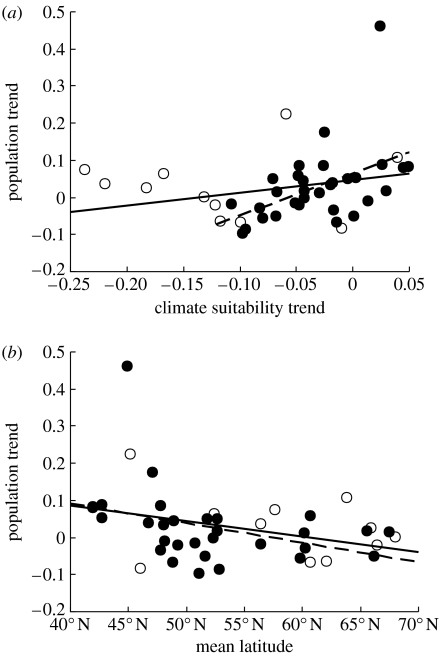
Figure 2.
(a) Average annual population trend of 42 rare breeding bird species in the UK during the period 1980–2004 in relation to the CST (see text) for each species derived from climate envelope models and annual meteorological data from the UK for the period 1980–2002. (b) Population trends in relation to the mean latitude of the European distribution in the 1980s. The solid line shows the linear regression fitted to all points. Open symbols denote species with a mean annual population in the UK of less than five pairs. The dashed line is the regression fitted only to those 31 species (filled symbols) with an average population of more than five pairs.

