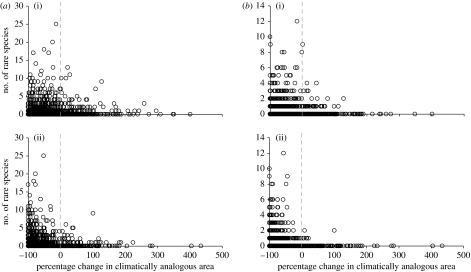
Figure 2.
Relationship between the number of small-range species ((a) plants and (b) butterflies) and projected future changes in climatically analogous area between reference (1961–1990) and future (2051–2060) time periods. Climate projections are based on the HadCM3 climate model with (i) B1 (moderate) and (ii) A1FI (severe) emission scenarios. Each point represents one European 0.5° grid cell. Dashed line indicates no change in climatically analogous area; −100% represents a complete loss of grid cells with climate analogous to the reference period 2051–2060.

