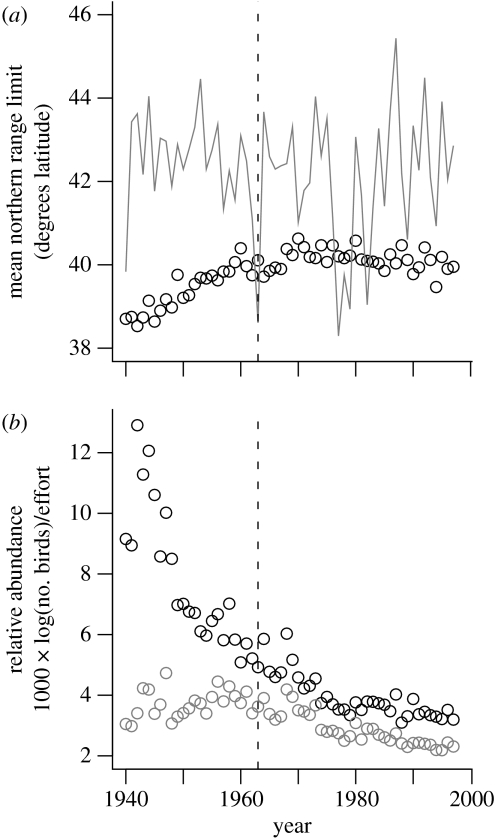
Figure 1.
Winter distribution and abundance of the field sparrow, 1940–1997. (a) Observed (black circles) and lower lethal (grey line) mean northern range limits. (b) Mean seasonal abundance (black circles) and mean aseasonal abundance (grey circles). The species stopped moving polewards in the year 1963 (vertical dashed lines). See the electronic supplementary material for details concerning trend calculations.

