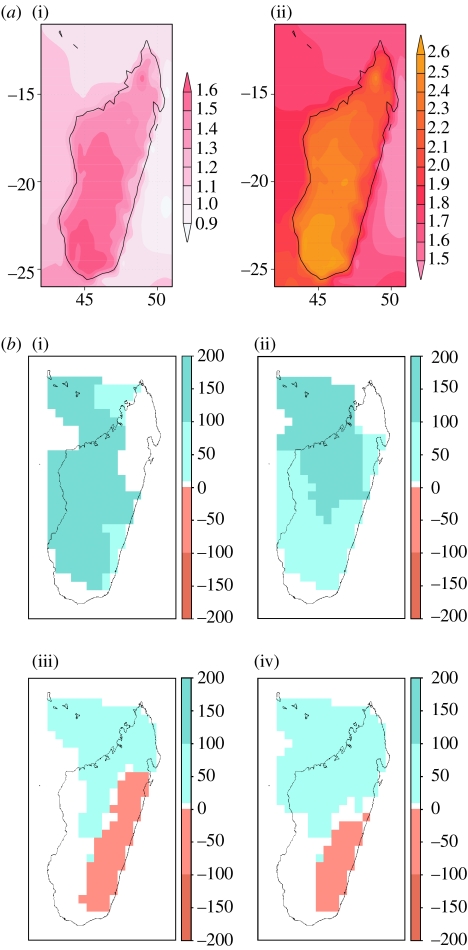
Figure 2.
(a) Maximum and minimum temperature increase scenarios for Madagascar. (i) Minimum and (ii) maximum increase derived from a suite of climate change projections. (b) Median change in total monthly rainfall (mm per month) for (i) January, (ii) April, (iii) July and (iv) September from six downscaled global models (for the period centred on 2055). Regions where three models give positive and three negative changes are left blank, as are those with increases less than 10 mm per month, which will be offset by increases in potential evapotranspiration.

