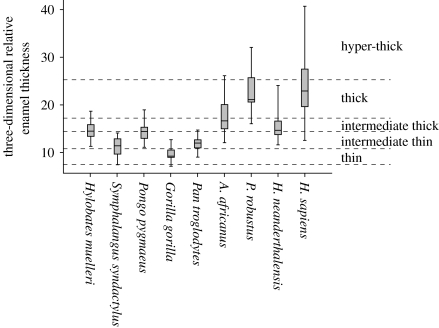
Figure 2.
Plot depicting three-dimensional RET ranges. Line inside the box represents the mean, ends of boxes are 25th and 75th percentiles and whiskers represent the range. Martin's (1985) thickness categories (and Grine & Martin's 1988 hyper-thick category) are shown to the right, and as dashed lines.

