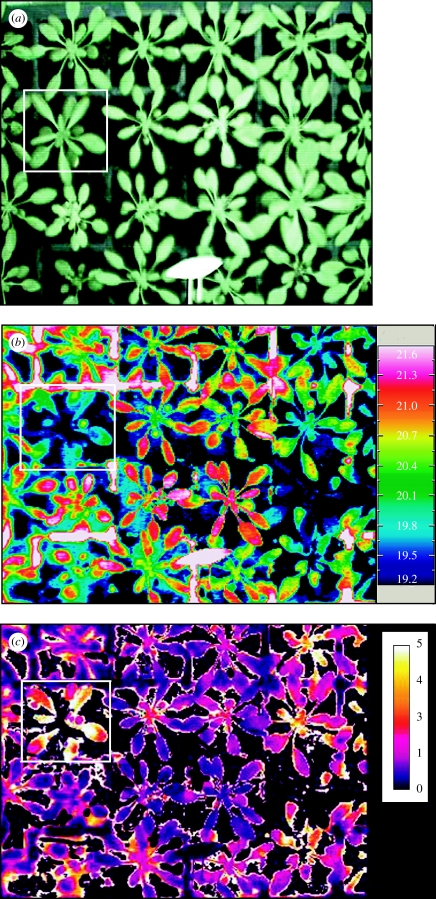
Figure 4.
(a) Visible image of Arabidopsis thaliana wild-type and OST mutants growing in a controlled environment cabinet. The ‘dry’ reference surface (white area) is visible. (b) Thermal image of same plants. OST mutant plant shown within white box is cooler (mean leaf temperature 19.9°C) compared with wild-type plants (mean leaf temperature range 20.3–21.0°C). (c) Calculated index of conductance (Ig) for the image in (b), calculated from temperature of leaves and dry and wet reference surfaces, using the method of Jones (1999).

