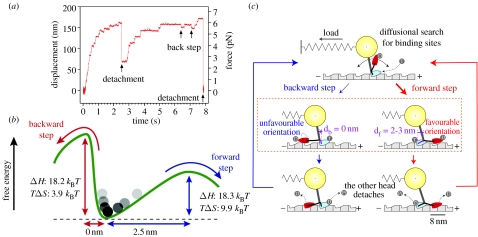
Figure 10.
Forward and backward step movements of kinesin. (a) Time course of the displacement of single kinesin molecule measured by optical trapping nanometry. (b) Free-energy landscape for kinesin forward and backward steps. (c) Biased stepping model for kinesin. Random steps are biased by preferential binding of the detached head to the forward binding site on microtubule, leading directional movement of kinesin.

