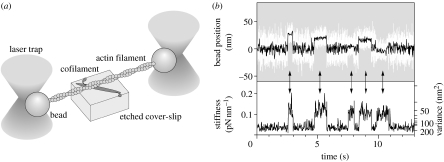
Figure 4.
Manipulation and force measurement between single actin filaments and single myosin using laser trap. (a) Schematic of the measurement. (b) Upper image: the time course of displacements by a single myosin molecule. White line represents raw data and black line represents the same data passed through a low pass filter of 20 Hz bandwidth. Lower image: changes in stiffness calculated from the variance of the displacement data as a monitor of the interaction of myosin with actin.

