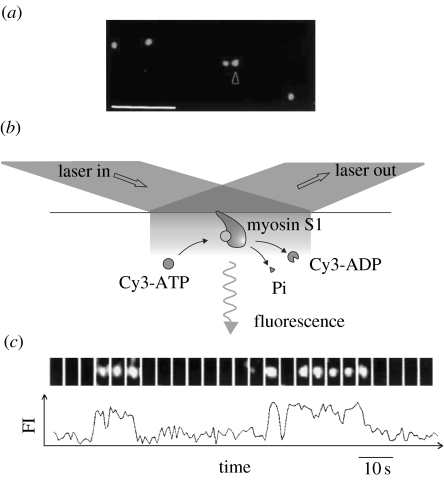
Figure 5.
Imaging of single fluorescent molecules using TIRFM. (a) Fluorescent micrograph of single Cy5-labelled S1 molecules bound to the surface of a glass slide. Scale bar, 5 μm. (b) Schematic of the visualization of the turnovers of a fluorescent analogue of ATP, Cy3-ATP, catalysed by single S1 molecules. (c) ATP turnovers by a single S1 molecule. Upper image: fluorescent image from Cy3-nucleotides bound to S1. Lower image: time course of the corresponding fluorescence intensity.

