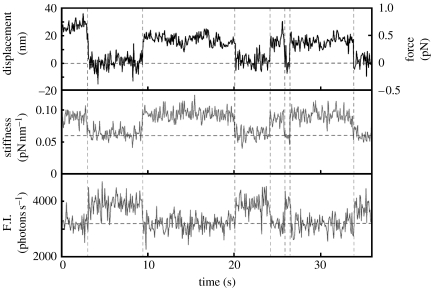
Figure 6.
The simultaneous observation of individual ATPase and mechanical events. The upper and lower traces show the time course of displacements and changes in fluorescence intensity from the Cy3-nucleotide bound to the myosin head, respectively. The middle trace shows the changes in the stiffness.

