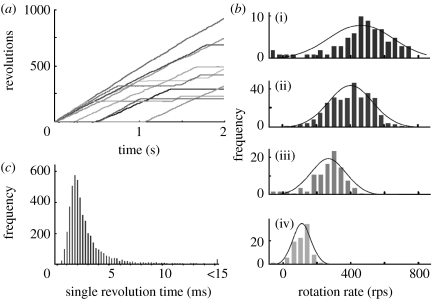
Figure 4.
Stochastic fluctuation of the γ subunit rotation. (a) Time courses for the gold beads. Rotation of randomly selected beads (60 nm diameter) was followed. (b) Histograms of rotation rates. The rotation rates of beads were estimated every 10 ms ((i) 40 nm, (ii) 60 nm, (iii) 100 nm, and (iv) 200 nm). (c) Single revolution time of gold beads. The time course of 60 nm beads was followed, and single revolution time (time required for the 360° revolution) is shown as histogram. Histograms obtained for 10 randomly selected beads are shown (see Ref. Nakanishi-Matsui et al. 2007 for coloured version).

