
Figure 3.
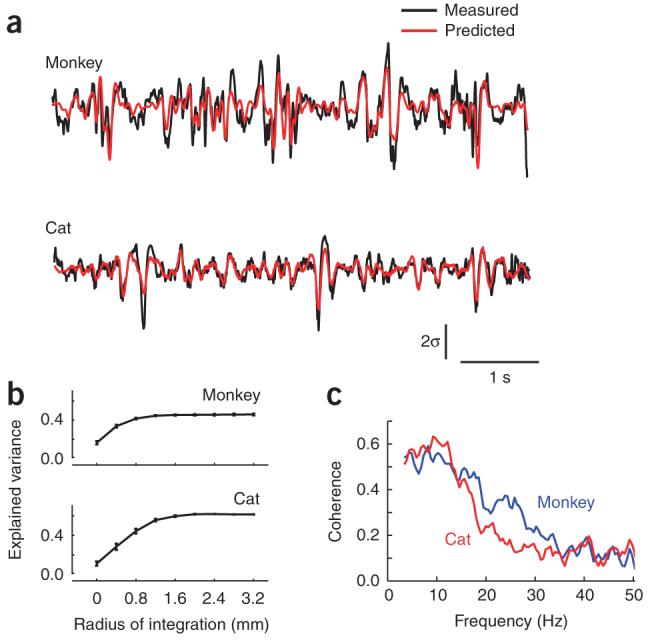
Predictions of LFPs from the spiking activity across a neuronal population. (a) Predictions for the LFP were generated on the basis of the linear superposition of the traveling waves induced by spikes across the entire array. Shown here are two examples of measured (black) and predicted (red) LFPs at one site in a cat and monkey. The vertical bar represents 2 s.d. of the LFP. (b) The predictions improved as the integration region, centered on the target LFP location, increased. The maximum amount of variance accounted for saturated for regions over ∼1.2 mm in radius. Error bars represent ± s.e.m. (c) Predictions best captured the low temporal-frequency components of the LFP. The graph shows the coherence between measured and predicted responses in the monkey and cat. Coherence was largest in the band between 2 and 15 Hz and decreased steadily to reach a baseline level at ∼35 Hz.