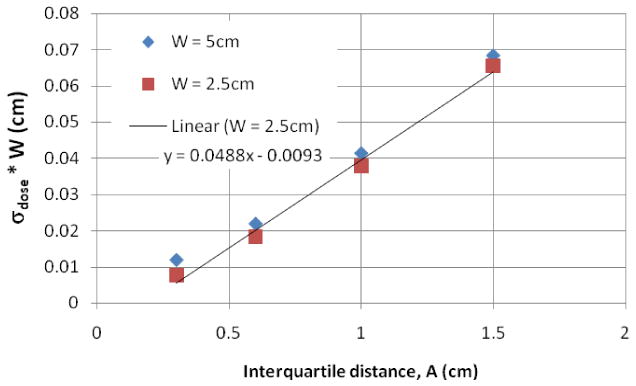
Fig. 10.

Results of the dose variation times the beam width of 20 breathing surrogate waveforms, one per patient. The amplitude is the interquartile distance between the 3rd and 1st quartiles of the longitudinal breathing displacement. Not shown is the 1cm beam which is the same size as the breathing motion and therefore all edge – not recommended. A linear trendline is also displayed for the W=2.5cm beam, but works equally well for the 5cm beam. The standard deviation has no units since it's a deviation from a dose normalized to the per fraction dose.
