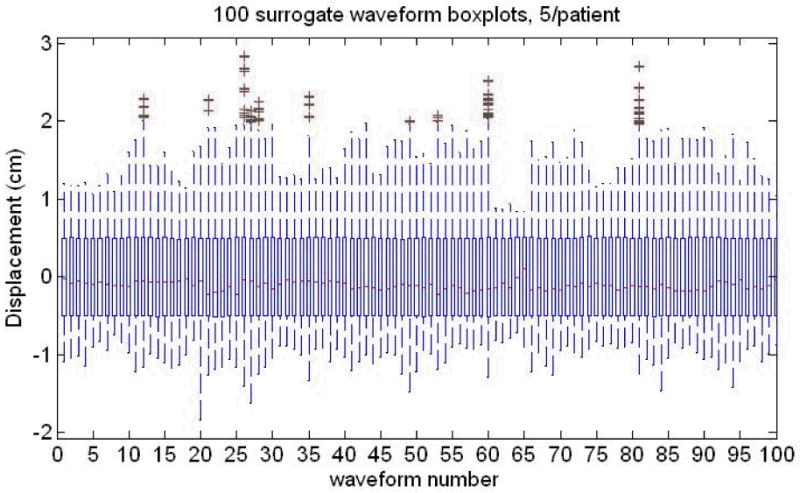
Fig. 3.

The Breathing surrogate waveforms from a large set of data provided to us [see text for more information]. The interquartile distance between the 3rd and 1st quartiles is varied but made the same, A, for all 100 waveforms, 5/patient, 20 patients. Note the large variation in outliers, medians (red lines inside the boxes) both within and between patients. The thin ‘box’ for each distribution is formed by the 1st and 3rd quartiles of the breathing displacement distribution.
