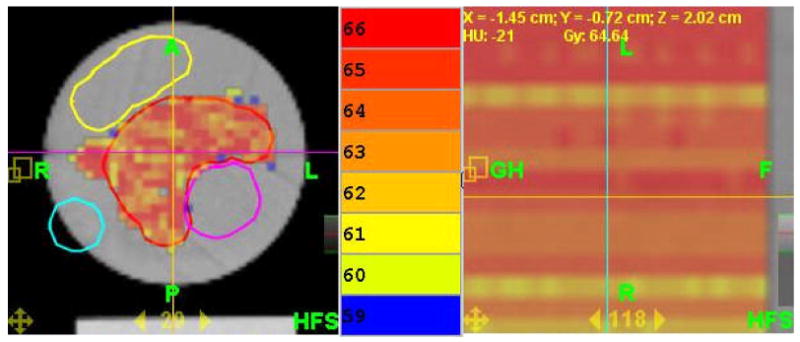
Fig. 5.

The TomoTherapy plan used in the experiment shown here with its calculated dose, transverse (left), and sagittal or longitudinal (right, note: expanded scale). The color bar is in the middle and note that the colors are separated by only 1 Gy. Also note that longitudinally in the PTV, the plan profile is very flat. The purple, yellow, and light blue structures are avoidance structures. See text for other details of the phantom and the plan.
